Infrared
Solutions IR SnapShot
Application
Use of infrared technology to
detect and see temperature differences allows people to accomplish many things
not possible or easily done in other ways:
- Moisture
Detection; - Infrared Inspection of
Roofs; - Building
Envelope; - Mechanical
Systems; - Electrical Systems
Moisture Detection
:
A key to prevention of mold growth
Mold has existed in our environment long before the recent awareness of its
presence in homes and businesses. The impact of mold on health is dependent upon
the concentration of spores in the immediate area and the allergic effect on an
individual. Potential health problems associated with mold exposure can take the
form of allergic reactions or asthma. The problem is not limited to homes.
Commercial buildings with moisture accumulation due to condensation or leaks are
a candidate for mold growth.
There is no practical
way to eliminate mold spores in an indoor environment. The best way to control
mold growth is to control moisture. Mold can begin growth in as little as 24
hours. Roof leaks and water pipe leaks are common sources of water accumulation
that may cause mold growth. Mold has closed public schools and caused companies
to spend millions of dollars on environmental tests and remediation. Clearly,
there is more reason to become aware of roof conditions, before water begins
dripping on a building owner’s head.
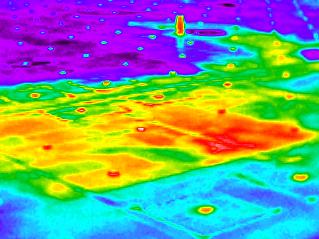 Moisture
present in roofs and walls can be detected with a sensitive infrared camera,
under the right conditions. Infrared roof inspections are performed most
effectively after sunset, when the roof gives off its heat energy accumulated
during the day. The heat capacity of moisture soaked roof insulation is greater
than that of dry insulation. As a result, the moisture soaked roof areas appear
quite clearly when performing an infrared scan.
Moisture
present in roofs and walls can be detected with a sensitive infrared camera,
under the right conditions. Infrared roof inspections are performed most
effectively after sunset, when the roof gives off its heat energy accumulated
during the day. The heat capacity of moisture soaked roof insulation is greater
than that of dry insulation. As a result, the moisture soaked roof areas appear
quite clearly when performing an infrared scan.
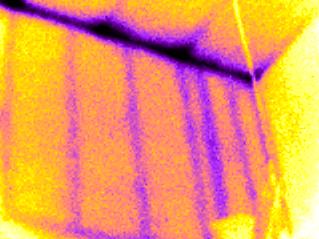
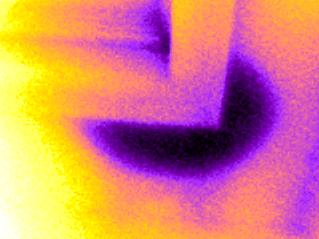 Similarly,
it is possible to detect moisture located behind interior walls with an infrared
camera, under the right conditions. The temperature difference created by the
presence of moisture on the inside surface of a wall will appear differently
than the surrounding area.
Similarly,
it is possible to detect moisture located behind interior walls with an infrared
camera, under the right conditions. The temperature difference created by the
presence of moisture on the inside surface of a wall will appear differently
than the surrounding area.
 Infrared
inspection is a fast, non-invasive method to discover moisture intrusion within
the building envelope. Infrared inspection does not directly detect the presence
of mold, rather it may be used to find moisture where mold may develop. The
limitations to obtaining accurate infrared images pertain to the ability of the
surface being scanned to emit heat energy. Gypsum (dry wall) in interior walls
emits quite well, whereas highly reflective surfaces do not. Since the
temperature difference between the wet and the dry wall are very slight, a
sensitive infrared camera must be used.
Infrared
inspection is a fast, non-invasive method to discover moisture intrusion within
the building envelope. Infrared inspection does not directly detect the presence
of mold, rather it may be used to find moisture where mold may develop. The
limitations to obtaining accurate infrared images pertain to the ability of the
surface being scanned to emit heat energy. Gypsum (dry wall) in interior walls
emits quite well, whereas highly reflective surfaces do not. Since the
temperature difference between the wet and the dry wall are very slight, a
sensitive infrared camera must be used.
Infrared Inspection of Roofs
Flat roof membranes are the waterproof barriers between the outside elements
and the interior of buildings. They come in a variety of materials and designs.
They must be able to expand and contract, resist high winds and the effects of
solar radiation and withstand foot traffic. It is easy to see why roofs leak.
 Normally
there is little or no water within a flat roof assembly. When a leak develops,
water enters the assembly and, depending on the type of insulation system, is
either absorbed by the insulation or runs to the cracks between the nonabsorbent
insulation. When water enters the roof assembly it is there for a long time,
sometimes the life of the roof.
Normally
there is little or no water within a flat roof assembly. When a leak develops,
water enters the assembly and, depending on the type of insulation system, is
either absorbed by the insulation or runs to the cracks between the nonabsorbent
insulation. When water enters the roof assembly it is there for a long time,
sometimes the life of the roof.
Thermal capacitance is the physical property of a material’s ability to
store heat. The materials in roof assemblies have relatively low thermal
capacitance, especially when compared to water. Water requires a lot of energy
to raise its temperature and likewise must release a lot of energy to cool.
The physics used for thermal roof inspections is that dry roof insulation
heats up and cools down faster than wet roof insulation. Infrared inspection
goes beyond simply finding a leak by locating the extent of the moisture
invasion of the insulation. To do this we require solar heating of a sunny day.
Then at night, after the sun goes down and the roof surface begins to cool, the
dry roof insulation cools faster than wet roof insulation.
Infrared inspections should be done under the right conditions to obtain the
best infrared images. We require a different temperature between the day and
night. For best results, here are some things to consider:
- Was it a clear sunny day?
- Is it a clear night (for good radiation cooling)?
- Is there little or no wind?
- Is the roof surface dry?
- Is the roof clear of snow, dirt and debris?
|
 |
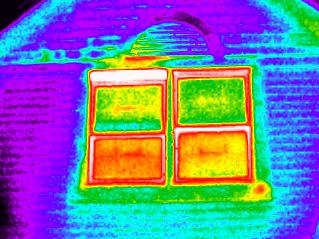
The type of insulation used on a roof will result in an infrared image that
is characteristic of how that particular insulation absorbs water. Absorbent
roof insulation acts similar to a sponge. The water migrates by capillary action
throughout a complete roof board before it jumps to the adjacent board. This
results in a checker board thermal pattern.
Nonabsorbent roof insulation creates a much different pattern when it becomes
wet. The water is not absorbed and runs to the edge of the roof board. The water
tends to collect at the edges of the boards resulting in a window frame pattern.
Different patterns may result from other less common insulating systems.
There are many conditions that can produce thermal patterns that may look
like they were created by wet insulation but are not, and others may mask the
true condition of wet insulation. The ASTM specification C-1153 titled
"Location of Wet Insulation in Roofing Systems Using Infrared Imaging"
suggest performing verification of suspected wet insulation by core methods. The
following are some examples of situations that may result in poor infrared
inspections:
- Insulation with different R-values or different absorption characteristics
which are commonly found in repaired areas
- Different internal building temperatures
- Extra gravel or bituminous left from construction
- Warm or cold air exhausting onto roof
- Re-radiation of heat from south or west facing walls
- Wind
- Internal sources of heat or cold such as lights, heaters, and steam pipes
- Dirt, vegetation and debris
- Walkway pads and buried steel plates
- Blisters
- Water ponding, steam plumes and water spray
During
the winter use the same process; however, winter surveys are more difficult
because the temperature differences are usually less than on summer surveys (5F
vs. 20F). If the building is heated, the added heat flow from the building
through wet insulation will help enhance the winter thermal patterns.
Building Envelope
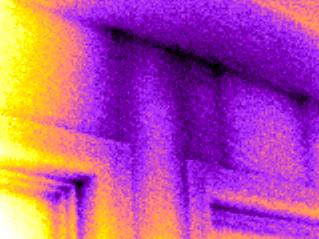
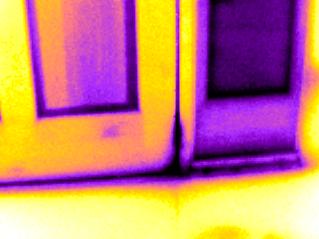
 The
primary diagnostic procedure for determining the thermal performance of a
building envelope is infrared thermography. It can be used to identify heating
and cooling loss due to poor construction, missing or inadequate insulation and
moisture intrusion. Correcting the defects plays a significant role in
increasing building efficiency and structural integrity.
The
primary diagnostic procedure for determining the thermal performance of a
building envelope is infrared thermography. It can be used to identify heating
and cooling loss due to poor construction, missing or inadequate insulation and
moisture intrusion. Correcting the defects plays a significant role in
increasing building efficiency and structural integrity.
Thermography can identify surface temperature variations of the building
envelope, which relates to problems in the structure, thermal bridging, moisture
content and air leakage.
Two primary mechanisms for heat loss in buildings are conduction through the
walls and air leakage. Both can be identified from the surface of the building
with infrared thermography. Early correction of the faults identified can be
made before extensive damage occurs.
 Conductive Losses
Problems identified as conductive losses are: missing insulation, improperly
installed or compressed insulation, shrinkage or settling of various insulating
materials; excessive thermal bridging in joints between walls and the top and
bottom plates; moisture damage to insulation and building materials; heat loss
through multi-pane windows with a broken seal; leaks in water pipes; damaged
heat ducts; location of, or leakage in buried steam lines, water lines or
underground sprinkler systems, etc.
 Air Leakage
Air
leakage is the passage of air through a building envelope, wall, window, joint,
etc. Leakage to the interior is referred to as infiltration and leakage to the
exterior is referred to as exfiltration. Excessive air movement significantly
reduces the thermal integrity and performance of the envelope and is, therefore,
a major contributor to energy consumption in a building.
In addition to energy loss caused by excessive air leakage, it can cause
condensation to form within and on walls. This can create many problems; reduce
insulation R-value, permanently damage insulation, and seriously degrade
materials. It can rot wood, corrode metals, stain brick or concrete surfaces,
and in extreme cases cause concrete to spall, bricks to separate, mortar to
crumble and sections of a wall to fall jeopardizing the safety of occupants. It
can corrode structural steel, re-bar, and metal hangars and bolts with very
serious safety and maintenance issues. Moisture accumulation in building
materials can lead to the formation of mold that may require extensive
remediation.
Virtually anywhere in the building envelope where there is a joint, junction
or opening, there is potential for air leakage. With the use of the
Mechanical Systems
In all plants there are diverse collections of equipment that can be
successfully inspected using infrared thermography. For most mechanical
equipment the techniques used to inspect the equipment are straightforward, but
specific knowledge and experience with some equipment is often required.
You should know the basic operation and heat flow characteristics of the
machinery, understand heat related failure mechanisms, have safety inspection
procedures and observe the machinery during startup and cool down as well as
during normal operation. No one knows the equipment in a plant better than the
plant personnel themselves do. It is very helpful to have past experience with
the equipment and thermal images of the equipment during normal operations.
We have a few examples of thermography for mechanical systems. The first two
thermograms, P) and Q) below show electric motors at 30C (54F) and 40C (72F)
above ambient, respectively. Thermogram R) shows a motor coil under test. The
camera operator is looking for shorts, which will show up as temperature
anomalies. Thermogram S) is a coupling for a high horse power motor and is 6C
(10F) below the motor bearing temperature and 12C (20F) below the machine
bearing temperature. It is well within its normal operating temperature.
 |
 |
 |
 |
| P) Electric motor |
Q) Electric Motor |
R) Coil Test |
S) Coupler |
Thermogram T) is an oil field natural gas compressor where the cylinder head
in the lower left of the picture shows signs of a valve problem. Not counting
the bolt head parts of the images, this cylinder head shows a 25C (45F)
temperature gradient. This gradient was felt to be excessive and it resulted in
a tear down and servicing of the compressor. Thermogram U) is an image of a
rotating one-foot diameter 3 feet long pinion gear that drives a 50-foot
diameter drum in a molybdenum mining operation. By monitoring the lengthwise
temperature gradient, the technician could monitor the gear alignment and its
life expectancy. Thermograms V) and W) are images of pipe with band heaters. V)
shows the heaters on and functioning and W) shows them not working.
 |
 |
 |
 |
| T) Compressor |
U) Pinion Gear |
V) Band Heater |
W) Band Heater |
Electrical Systems
Abnormal heating associated with high resistance or excessive current flow is
the main cause of many problems in electrical systems. Infrared thermography
allows us to see these invisible thermal signatures of impending damage before
the damage occurs. When current flows through an electric circuit, part of the
electrical energy is converted into heat energy. This is normal. But, if there
is an abnormally high resistance in the circuit or abnormally high current flow,
abnormally high heat is generated which is wasteful, potentially damaging and
not normal.
Ohm’s law (P=I2R) describes the relationship between current,
electrical resistance, and the power or heat energy generated. We use high
electrical resistance for positive results like heat in a toaster or light in a
light bulb. However sometimes unwanted heat is generated that result in costly
damage. Under-sized conductors, loose connections or excessive current flow may
cause abnormally high unwanted heating that result in dangerously hot electrical
circuits. Components can literally become hot enough to melt.
The IR SnapShotTM enables us to see the heat signatures associated
with high electrical resistance long before the circuit becomes hot enough to
cause an outage or explosion. Be aware of two basic thermal patterns associated
with electrical failure: 1) a high resistance caused by poor surface contact and
2) an over loaded circuit or multi-phase imbalance problem.
Contact Problems Heat is produced by current flow through a contact with high electrical
resistance. This type of problem is typically associated with switch contacts
and connectors. The actual point of heating may often be very small, less than a
1/16 inch when it begins. Below are several examples found with the IR SnapShot
during customer demonstrations.
Thermogram A) is a motor controller for an elevator in a large hotel. One of
the three phase connections was loose, causing increased resistance at the
connector. The excess heating produced a temperature rise of 50 degrees C (90F).
Thermogram B) is a 3-phase fuse installation where one end of one fuse has poor
electrical contact with the circuit. The increased contact resistance caused a
45C (81F) hotter temperature at that connection than at the other fuse
connections. Thermogram C) is a fuse clip where one contact is 55C (99F) hotter
than the others. And thermogram D) is a two-phase wall plug-in where the wire
connections were loose causing the terminals to heat 55C (100F) hotter than the
ambient.
 |
 |
 |
 |
| A) Controller |
B) 3 Phase Fuse |
C) Fuse Clip |
D) Wall Plug |
All four of these examples were serious and needed immediate attention.
Thermogram B) shows an interesting principal used in interpreting thermal
patterns of electrical circuit. The fuse is hot at one end only. If the fuse
were hot at both ends, the problem would be interpreted differently. An
overloaded circuit, phase imbalance, or an undersized fuse would cause both ends
of the fuse to overheat. Being hot at one end only suggests that the problem is
high contact resistance at the heated end.
 The wall plug in
Thermogram D) was seriously damaged as seen in the visual picture to the right,
however, it continued to operate until it was replaced.
The wall plug in
Thermogram D) was seriously damaged as seen in the visual picture to the right,
however, it continued to operate until it was replaced.
Overloaded Circuit Problems The following thermograms show overloaded circuits. Thermogram E) shows a
circuit panel in which the main breaker at the top is over heated 75C (135F)
above ambient. This total panel is overloaded and in need of immediate
attention. Thermograms E) and F) show all the standard circuit breakers over
heated. Their temperatures were 60C (108F) above ambient. Although in the
thermogram the wires are blue in color they are also hot, 45 to 50C (81 to 90F).
This entire electrical system needs to be redone.
 |
 |
 |
 |
| E) Circuit Panel |
F) Circuit Panel |
G) Controller |
H) Current Xformer |
Thermogram G) shows one line of a controller that is about 20C (36F) above
the others. This needs further investigation to determine why one wire is that
much hotter than the others are and to determine the repair needed. Thermogram
H) shows a current transformer that is 14C (25F) warmer than the other two
transformers in a 3-phase service installation. This indicates a serious
imbalance of the service or a faulty current transformer that could seriously
impact the customer’s utility bill.
Load Requirements When making an inspection it is important that the system is under load. Wait
with the inspection for "worst case" or peak loads, or when the load
is at least 40% (according to NFPA 70B). Heat generated by a loose connection
rises as the square of the load; the higher the load, the easier it is to find
problems.
Surface Temperatures Only Infrared cameras including the IR SnapShot can not see through electrical
cabinets or solid metal bus trays. Whenever possible open enclosures so the
camera can directly see the electrical circuits and components. If you find an
abnormally high temperature on the outside surface of an enclosure, rest assured
that the temperature is even higher, and usually much higher, inside the
enclosure. Below are some thermograms taken of a bus enclosure, which identify a
serious problem with the electrical buses inside the enclosure. The hot spots
were on the order of 10C hotter than the ambient and 6C hotter than other parts
of the bus enclosure.
 |
 |
 |
 |
| I) J) K) L) Bus enclosures |
Electric Distribution Literally hundreds of different pieces of equipment may be found in an
electrical system. They start with the utility electricity production, high
voltage distribution, switchyards and substations, and end with service
transformers, switchgear, breakers, meters, local distribution, and appliance
panels. Many utilities have purchased the IR SnapShot to help with their
maintenance. And nearly every type of industry has bought IR SnapShots to help
with maintenance on their end of the electrical distribution system.
Thermogram M) is a service transformer that had leaked some cooling oil,
resulting in dangerously over heated coils near the top. One connection was 160C
(288F) above ambient. This transformer needed immediate replacement but the
company wanted to delay the repair one month so it could be done during a
scheduled total plant shutdown. They used the IR SnapShot camera to monitor the
state of the transformer and successfully delayed the repair. Thermogram N) is
for a pole mounted service transformer that has a connection 30C (54F) hotter
than ambient. Such a condition required maintenance at the next convenient
opportunity. Thermogram O) shows a hot main connection on an interrupter at a
substation in Mexico. The connection was found to be 14C (25F) hotter than the
others. This was believed to be a problem that needed attention. Thermogram P)
shows an overhead connection in a Peru substation. It was less than 10C or (18F)
above ambient and not of immediate concern.
 |
 |
 |
 |
| M) Transformer |
N) Transformer |
O) Interrupter |
P) Connection |
Bercu nv
Noordschippersdok 13
T. +32 3 225 32 73
ejb@bercu.be
B-2060 Antwerp
F. +32 3 234 18 49
Belgium
www.bercu.be www.bercu.com Copyright @ Bercu nv. All rights
reserved.